The following is a guest contributed post from Dr. Mona Yousry, Chief Data Scientist, Sabio Mobile.
The amount of data that people generate simply by living their lives can be used to tell stories filled with context and insights. This information, combined with digital data, enriches our understanding of consumers and, by extension, the physical world. Big data, mobile phones, social media and behavior analytics each play a vital role in teasing out this understanding; as a result, they allow companies to gain a competitive edge, and are the future of business intelligence.
But what does data intelligence really mean? To put it simply, data intelligence is the ability to identify and analyze relationships, and to visualize the data associated with them. That is to say, business intelligence unifies sources of unstructured data together with up-to-date visualizations in order to access information on trends and experiences quickly.
Most people will already be familiar with the term “big data”. But what many people don’t realize is that the number of data sources that big data can draw from is increasing at a rapid clip, which in turn affects the quality of the insights that business applications will be able to generate. Having more – and better – data also allows for better AI, because the more high-quality data you have to train your systems, the better your AI algorithms will be.
Data opportunities and challenges
Implementing big data successfully is often a challenge for businesses, in part because of the oft-cited “Vs” of big data. Gartner’s 3Vs, variety, velocity, and volume, have traditionally been the way that most practitioners understand big data.
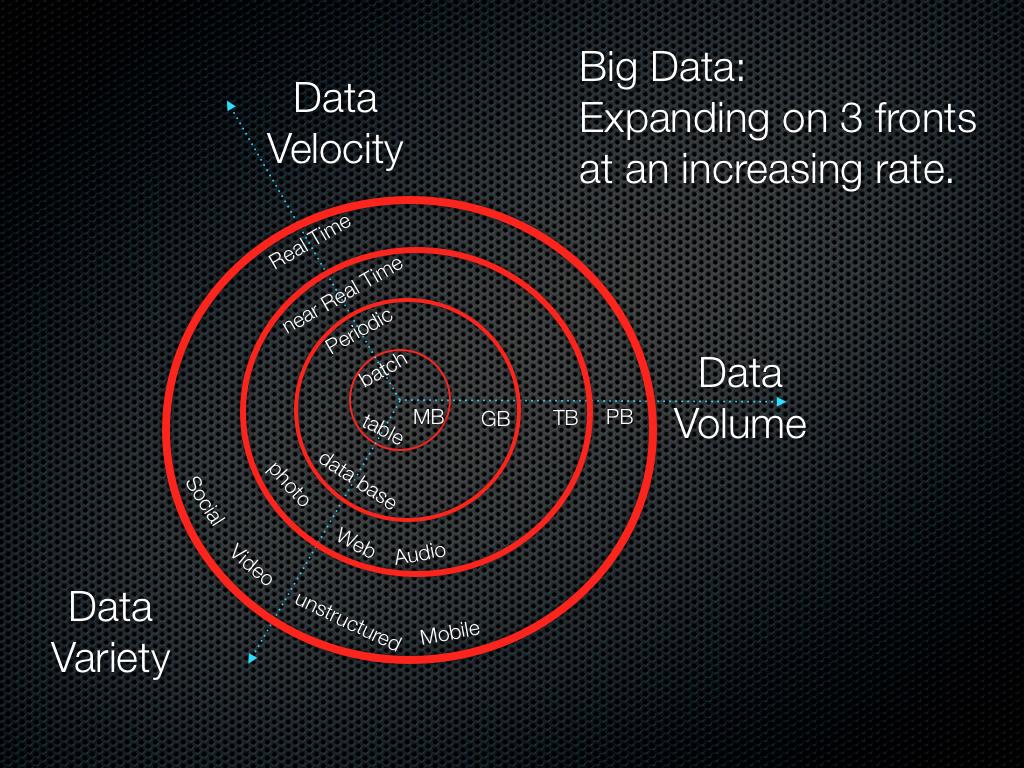
However, in some ways, the traditional way of thinking about big data ignores the larger picture – that is to say, how to interpret such massive amounts of data. As a result, we need to look beyond the original Vs, to what I call the 6V Wheel. In addition to variety, velocity, and volume, organizations also need to be thinking about validity, verification, and visualization.
Let’s start with the traditional Vs. Variety refers to the fact that not all data is created equally. No longer is it a set of observations and measurements that we can apply regression or time series to; instead, we think of data as a set of patterns that can drive amazing insights, particularly when made up of information from multiple sources. In the near past, a retailer might have relied on information drawn from e-commerce sites and social media – but now, with advances in location technology, one can look at data gathered from physical retail locations and points of sale, and subsequently gain more insight into shopping trends and behaviors. As mobile apps and devices have become smarter and more responsive to their environments, the variety of data available has exponentially increased. Most of this information is already in the hands of organizations, yet few are using it to drive value.
Velocity is a characteristic of data, frequently equated to real-time analytics. It is the rate of changes – about linking data sets that are coming with different speeds and bursts of activities. When the spatio-temporal relationship between two or more data sets changes, then everything else changes, even the definition of a “data event.”
Volume refers simply to the amount of data. Keep in mind that simply having more information than your competitor is not a guarantor of success; rather, it comes down to how effectively that information is being used to drive business performance.
Now for the three new Vs:
Validity refers to a question that our AI and machine learning intelligence is continuously addressing: how effective are these methods? For us, it is the accuracy and how pervasive is our model. We look at many combinations to relate interactions, habits and behaviors, as only then can we start to understand audience needs (with their privacy still intact). For businesses, the power is in the insights that allow them to measure performance, create value, drive awareness for new offerings, improve loyalty, increase sales, and countless other actions that are beneficial for their organizations. All of this is a validation of big data.
Verification is the process of establishing the accuracy of something; in other words, the establishment by empirical means of the validity of a proposition. Can a business verify that a customer responds well to a specific notification? How do you know if a particular ad was the reason someone visited a store? How good are your campaigns at driving attribution? How relevant are your ads to people? With AI, and the new types of data that are being collected, all of these questions can now be answered.
Finally, Visualization refers to how we dynamically see the data – and the intelligent decisions we make as a result of understanding those insights. Understanding data can be a complicated matter, and it needs to be easily digestible so that marketers and management can quickly assess what is and isn’t working, and make the right decisions.
While Gartner’s 3Vs provide a good baseline, this new 6Vs Vision creates a more holistic and comprehensive way to view data. This is especially vital as the importance of app science, geolocation, and mobile continue to grow exponentially, and as big data continues to create value for organizations.